 Guides
In 2026, user acquisition strategy operates under structural pressure.
Tier-1 CPMs remain elevated. Auction density continues to increase. Signal clarity fluctuates across platforms. Capital carries higher expectations for efficiency and recovery speed.
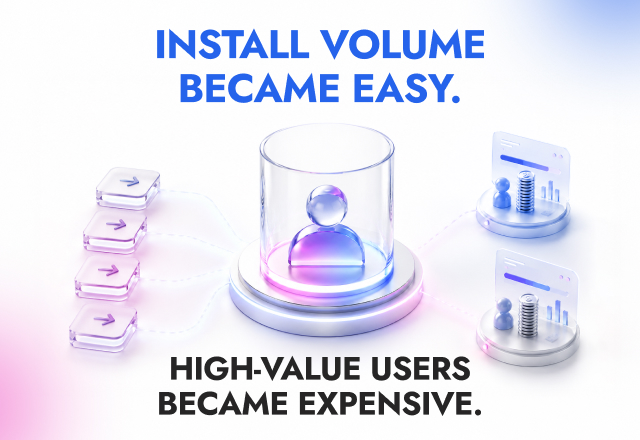
In this environment, CPI no longer defines scale capacity.
Payback velocity does.
The ability to rotate capital efficiently determines how far a team can expand, how aggressively it can allocate budget, and how resilient it remains under auction pressure.
The Structural Shift in UA Economics
For years, performance marketing KPIs revolved around:
- minimizing CPI
- reaching nominal ROAS milestones
- increasing volume before validating capital efficiency
These metrics still provide diagnostic insight. They help evaluate channel mechanics and creative performance.
But they do not define scaling permission.
Scaling permission is determined by capital recovery speed.
The faster capital returns, the faster it can be redeployed.
The faster it is redeployed, the wider the safe scaling corridor becomes.
In 2026, scale is a function of capital velocity.
Why Nominal ROAS Misguides Scale Decisions

Nominal ROAS provides a static snapshot.
Scale is dynamic.
Payback horizons vary by product model and vertical. Subscription apps, gaming products, fintech services, and utility apps operate on fundamentally different monetization curves.
The relevant question is not whether payback occurs within a specific timeframe.
The relevant question is whether the recovery horizon supports the intended pace of scale.
When capital recovery aligns with growth strategy:
- reinvestment cycles remain predictable
- budget allocation becomes structured
- scaling decisions maintain discipline
Velocity compounds inside the economic logic of the product.
Defining a Healthy Scale Window in 2026
A healthy scale window is not defined by blended ROAS.
It is defined by three structural variables:
- Marginal payback on incremental spend
- Stability of early revenue signals
- Capital recovery horizon aligned with business cashflow
Blended ROAS can remain stable while marginal capital efficiency deteriorates. This is where scaling becomes fragile.
Advanced UA teams monitor:
- marginal payback per incremental dollar
- recovery curve consistency by channel
- time-to-breakeven variance across cohorts
This reframes the core decision from:
“Can we scale?”
to:
“Can we scale within capital discipline?”
Operational Signals That Indicate Payback Stress

In practice, capital strain rarely appears through headline metrics.
Common structural signals include:
- marginal CPA expanding while blended ROAS remains stable
- increased variance in early revenue events across new cohorts
- recovery curves flattening at higher spend tiers
- channel-level instability masked by aggregate reporting
When these signals emerge, scale logic requires recalibration.
The goal is not to reduce volume immediately. The goal is to protect capital rotation speed.
Channel Strategy When Payback Leads
When payback velocity becomes the primary KPI, channel strategy evolves.
Auction-driven platforms remain essential for volume. Their volatility directly influences recovery stability.
Channels with:
- steadier pricing environments
- predictable early event density
- slower efficiency decay
gain strategic importance.
In 2026, multi-source execution reflects capital balancing rather than diversification.
Some channels accelerate acquisition volume. Others stabilize capital recovery.
The portfolio mix defines margin durability under auction pressure.
The Real KPI Shift in User Acquisition Strategy

Mature UA teams now prioritize:
- payback velocity
- marginal capital efficiency
- recovery stability under scale pressure
CPI serves as a diagnostic metric. ROAS validates return layers. Payback defines scaling permission. This KPI evolution changes budget allocation logic, channel weighting, and growth forecasting.
Capital Velocity Exists Inside a Product System
User acquisition does not operate in isolation.
Payback speed is shaped by:
- product experience
- funnel architecture
- monetization design
- pricing strategy
- development cadence
UA influences acceleration. Product determines value depth.
When acquisition strategy aligns with product economics:
- scale expands with structural stability
- volatility becomes manageable
- margin protection strengthens
Growth becomes engineered rather than purchased.
Strategic Outlook: Scale Follows Capital Speed
In 2026, sustainable scale belongs to teams that manage capital velocity precisely.
Capital rotation speed determines competitive leverage. When acquisition logic and product economics move in sync, scale compounds. Scale follows capital speed.